CBSE Class 9 Maths Chapter 14 Solutions – Download Free PDF Notes
Statistics deals with the interpretation and handling of data. This chapter demands a focused study from the students. It has various new concepts and unseen formulae. Thus, making it an unfamiliar chapter for the students. The best way to study this chapter is from the study material provided by GharPeShiksha. The material contains all the crucial points along with a step-by-step explanation. It also includes Revision Notes, NCERT solutions, NCERT Exemplar Solutions, Previous Year Questions of this Chapter, Formulae Sheet, Model Answer Sheets designed by expert teachers. The study material is updated each year as per the syllabus requirements and is consistent with the new exam pattern. It has a lot of practice questions for the students to get a firm grip on the concepts. It also helps them to memorize the formulae introduced in the chapter. It is available on the website of GharPeShiksha.
What is Statistics?
Statistics is the study of the collection, analysis, interpretation, presentation, and organisation of data. In other words, it is a mathematical discipline to collect, summarise data.
Data
Data is a collection of facts, such as numbers, words, measurements, observations etc.
Collection of Data
- Discrete data- has a particular fixed value. It can be counted.
- Continuous data- is not fixed but has a range of data. It can be measured.
Applications
Some of the applications of statistic are given below:
- Applied statistics, theoretical statistics and mathematical statistics
- Machine learning and data mining
- Statistics in society
- Statistical computing
- Statistics applied to mathematics or the arts
Presentation of Data
- Ungrouped Data
- Raw data- If there is no change in the data and it is in the same form as it is collected then it is said to be raw data.
Note: The difference between the highest and the lowest number of data is called Range.
- Frequency Distribution- Frequency is the number of times the item comes in the table. When the number of items is large then we can convert it into the tabular form which is called a Frequency Distribution Table.
Grouped Data– It is used to present the very large number of items.
Terms to Remember-
- a. Class Interval – The group used to classify the data is called the class interval i.e. 10 – 20, 30 – 40.
- b. Upper Limit – In each class interval, the greatest number is the upper-class limit.
- c. Lower Limit – In each class interval, the smallest number is the lower class limit.
- d. Class Size – It is the difference between the upper limit and the lower limit i.e. 10.
- e. Class Mark – The midpoint of each class interval is the class mark.
Types:
- Continuous Frequency Distribution– If the upper limit of one class is the same as the lower limit of the next class then it is said to be continuous Frequency Distribution.
- Discontinuous Frequency Distribution- If the upper limit of one class is different from the lower limit next class then it is said to be discontinuous Frequency Distribution.
GRAPHICAL REPRESENTATION OF DATA
- Bar Graph– Bar Graph is used to display the category of data and it compares the data using solid bars to represent the quantities.
Example:
- Histogram– The graph that uses bars to represent the frequency of numerical data that are organized into intervals. Since all the intervals are equal and continuous, all the bars have the same width.
- Frequency polygon– Obtain the frequency distribution and find the midpoints of each class interval.
- Represent the midpoints along x-axis and frequencies along the y-axis.
- Plot the points corresponding to the frequency at each midpoint.
- Join these points, using lines in order.
- To complete the polygon, join the point at each end immediately to the lower or higher class marks on the x-axis.
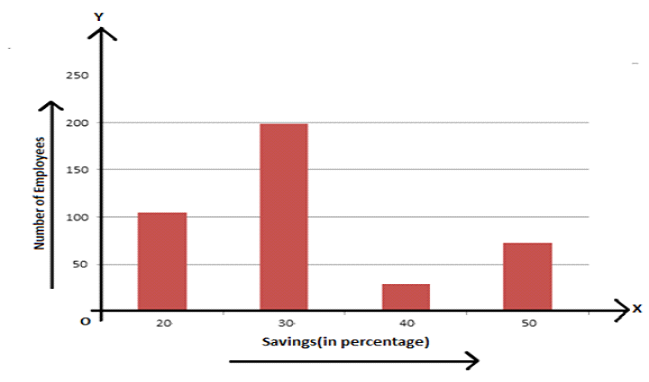
Example 1: In a firm of 400 employees, the percentage of monthly salary saved by each employee is given in the following table. Represent it through a bar graph.
| Savings (in percentage) | Number of Employees(Frequency) |
| 20 | 105 |
| 30 | 199 |
| 40 | 29 |
| 50 | 73 |
| Total | 400 |
Solution:
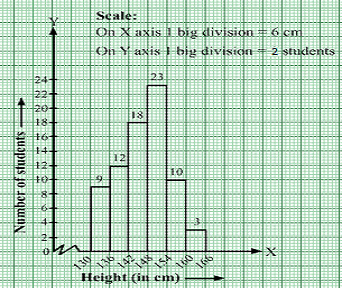
Example 2. The heights of 75 students in a school are given below:
| Height (in cm) | 130−136 | 136−142 | 142−148 | 148−154 | 154−160 | 160−16 |
| Number of students | 9 | 12 | 18 | 23 | 10 | 3 |
Draw a histogram to represent the above data.
Solution: Represent the class intervals [heights (in cm)] along the x-axis & the corresponding frequencies [number of students ] along the y-axis.
Scale:
On x-axis: 1 big division = 6 cm
On y-axis: 1 big division = 2 students
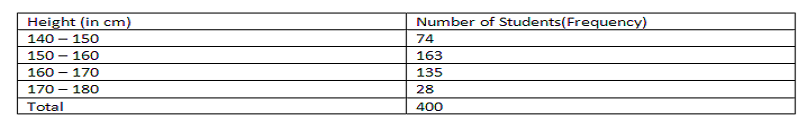
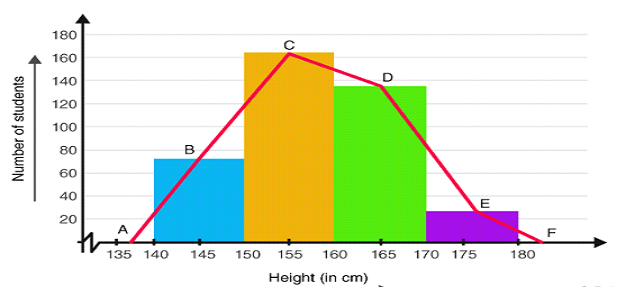
Example: In a batch of 400 students, the height of students is given in the following table. Represent it through a frequency polygon.
MEASURE OF CENTRAL TENDENCY
- MEAN
Example:
Mean (if individual observations are given)– Sum of all observations/No. of observations
Example: The daily minimum questions solved by a student during a week were as under:
| Monday | Tuesday | Wednesday | Thursday | Friday | Saturday |
| 35 | 30 | 27 | 32 | 23 | 28 |
Find the mean.
Solution:
Number of questions solved in a week: 35, 30, 27, 32, 23, 28.
So, we get,
Mean = sum of observation/ total no of observations = (35+30+27+32+23+28) / 6 = 175/6 = 29.167
- MEDIAN– After arranging the given data in an ascending or descending order. The middle most value of all the observations.
If n(number of observations) is odd, Median =[(n+1)/2]th observation.
If n is even, the Median is the mean or average of (n/2)th and [(n+1)/2]th observation.
Example: The Number of books issued to 13 students in a class are:
25, 19, 24, 23, 29, 31, 19, 20, 22, 26, 17, 35, 21.
Find the median no. of books for the above data.
Solution:
Let’s arrange the data given in ascending order – 17, 19, 19, 20, 21, 22, 23, 24, 25, 26, 29, 31,35.
n= 13, (odd number)
Median = (n+1) / 2 observations
= (13+1)/ 2 = (14/2)th observation = 7th observation = 23
MODE– The mode is that value of the observation which occurs most frequently, i,e., an observation with the maximum frequency is called the mode.
Example- Find the mode of the following numbers:
9, 4, 17, 23, 4, 9, 11, 4, 17, 4, 23, 17, 7, 4, 11
Sol: From the above observations, 4 occurs maximum times.
Therefore, mode= 4